SQL Server Memory Management
- MikeBennyhoff
- Mar 7, 2024
- 8 min read

In the world of SQL Server, memory is the cornerstone of performance. As one of the most essential resources in database management, efficient memory handling can be the difference between a lightning-fast query and a sluggish bottleneck. Yet, despite its critical role, the server memory management can seem like a labyrinth of complex settings, dynamic behaviors, and elusive best practices. Suppose you’re a database administrator, an SQL developer, or an IT professional looking to maneuver through the intricacies of optimizing the server memory options for your own SQL Server instance. In that case, this comprehensive guide will serve as your compass.
Introduction to SQL Server Memory Management
Understanding SQL Server Memory Architecture
Within the SQL Server environment, memory is meticulously partitioned into distinct components, each serving a unique purpose in facilitating database operations. The Buffer Pool acts as a reservoir for caching data pages, while the Procedure Cache stores execution plans and query results for rapid access. Workspace Memory caters to all the memory using needs of various user sessions, accommodating temporary tables and sorting operations. Additionally, Memory Clerks manage allocations for specific tasks, contributing to the efficient utilization of available resources.
Memory Configuration Settings
Configuring memory settings in SQL Server entails a delicate balancing act to optimize performance while avoiding resource contention. Key parameters such as Max Server Memory and Min Server Memory govern the upper and lower bounds of sql server memory allocation used, ensuring that each SQL Server instance operates within defined constraints. Fine-tuning these settings based on workload characteristics and system requirements is essential to harnessing the full potential of available total sql server memory allocation and resources.
Monitoring Memory Usage
Monitoring memory usage in SQL Server is crucial for maintaining optimal performance and preventing issues such as memory pressure, which can lead to performance degradation. Here are some methods and tools you can use to monitor memory usage in SQL Server:
Dynamic Management Views (DMVs):
SQL Server provides several DMVs that can be used to monitor memory usage. Some commonly used DMVs include:
sys.dm_os_performance_counters: Provides performance counter information, including memory-related counters such as Page Life Expectancy and Buffer Cache Hit Ratio.
sys.dm_os_memory_clerks: Provides information about memory clerks, including the amount of memory allocated by each clerk.
sys.dm_os_memory_objects: Provides information about memory objects allocated in the SQL Server instance.
sys.dm_os_sys_memory: Provides information about the overall memory usage by SQL Server.
Performance Monitor (PerfMon):
PerfMon is a built-in Windows tool that allows you to monitor various performance counters, including those related to SQL Server memory usage.
You can use PerfMon to track memory-related counters such as Available Memory, SQL Server Buffer Manager counters, and SQL Server Memory Manager counters.
SQL Server Management Studio (SSMS):

SSMS provides built-in reports and views for monitoring SQL Server performance, including memory usage.
You can use the “Memory Usage By Memory Object” report in SSMS to view memory usage by different memory objects in SQL Server.
When monitoring memory usage in SQL Server, it’s essential to pay attention to key memory-related metrics such as:
Total Server Memory
Target Server Memory
Total Physical Memory
Available Physical Memory
Page Life Expectancy (PLE)
Buffer Cache Hit Ratio
Memory Grants Pending
By regularly monitoring these metrics using the methods described above, you can proactively identify memory-related issues, optimize memory usage, and ensure the optimal performance of your SQL Server instances.
Understanding SQL Server Memory Architecture
In the intricate ecosystem of SQL Server, memory plays a pivotal role in facilitating efficient database operations. Understanding the architecture of the instance of the SQL Server database and database memory is essential for optimizing performance, managing resources effectively, and troubleshooting issues. This section provides an overview of the key components and mechanisms that comprise each instance of SQL Server’s memory architecture.
Buffer Pool
At the heart of SQL Server’s memory architecture lies the Buffer Pool, a crucial component responsible for caching data pages. When data is read from disk or modified, it is first loaded into memory buffers within the Buffer Pool. This cached data enables rapid access to frequently accessed data, reducing disk I/O and enhancing overall query performance.
Procedure Cache
The Procedure Cache is a repository for storing execution plans and query results. When a query is executed, SQL Server generates and caches an execution plan in memory, allowing subsequent executions of the same query to benefit from plan reuse. Additionally, query results may be cached in memory to expedite retrieval and minimize processing overhead.
Workspace Memory
Workspace Memory caters to the needs of individual user sessions, providing temporary storage for operations such as sorting, hashing, and joining. Each user session is allocated a portion of Workspace Memory to perform in-memory computations and manipulate intermediate result sets.
Memory Clerks
Memory Clerks manage allocations and deallocations of memory within SQL Server, serving as intermediaries between the Buffer Pool, Procedure Cache, Workspace Memory, and other memory components. Each Memory Clerk is responsible for currently allocated memory and for a specific type of memory allocation, such as database pages, thread stacks, or query execution contexts. By regulating memory usage and enforcing memory limits, Memory Clerks contribute to efficiently utilizing available memory resources.
Memory Manager
The Memory Manager orchestrates memory allocation and deallocation operations within SQL Server, coordinating the activities of various memory components and enforcing to control memory usage within limits specified in the server memory configuration options and settings. Through sophisticated algorithms and mechanisms, the Memory Manager strives to optimize memory usage, mitigate contention, and maintain system stability.
Dynamic Memory Management
SQL Server employs dynamic memory management techniques to dynamically adapt to changing workload demands and optimize resource utilization. Memory allocations are adjusted dynamically based on factors such as query execution plans, concurrent user activity, and system-wide memory pressure. This dynamic allocation and deallocation of memory resources ensure efficient utilization of available memory and optimal performance under varying workload conditions.
Configuring Memory Settings in SQL Server
Image Of SQL Server Management studio Memory Settings
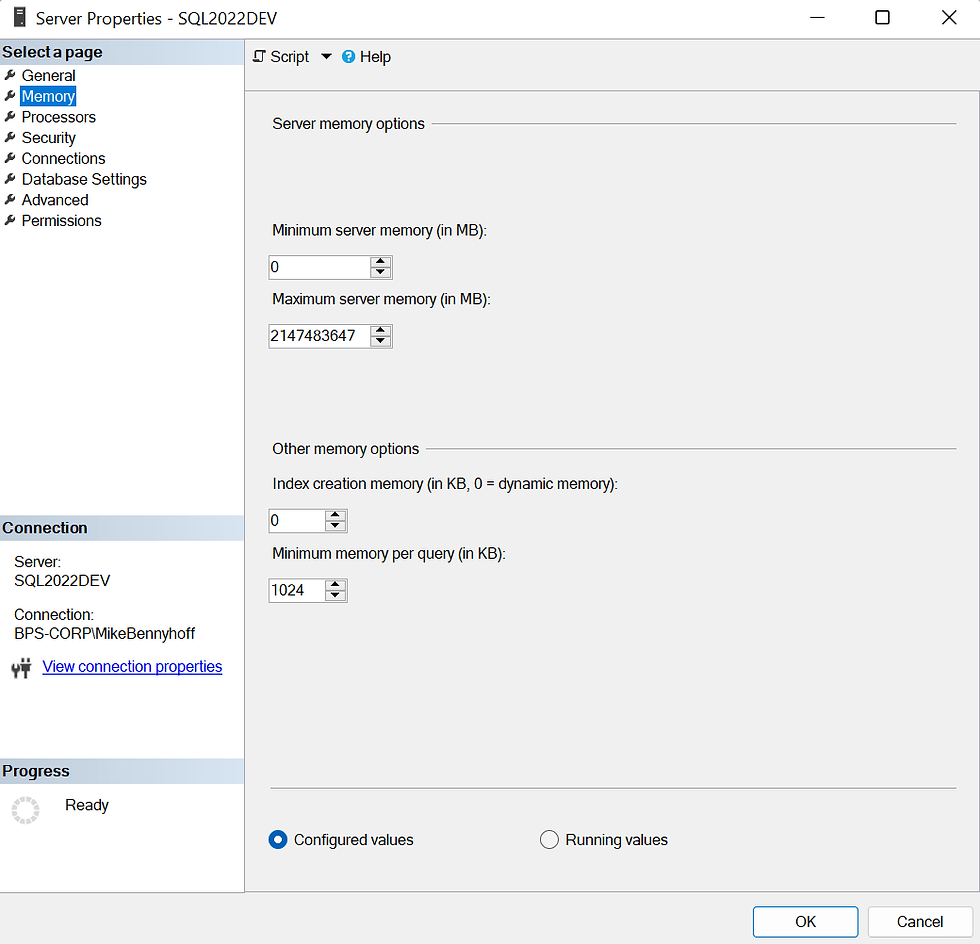
Setting Max and Min Server Memory
Setting the maximum server memory is an essential aspect of optimizing server performance, especially in environments where multiple applications run on the same server. Here are some general recommendations for setting the the maximum memory amount and minimum server memory amount:
Understand your system: Before setting the maximum server memory, it’s crucial to understand the resources available on your system, including the total physical memory (RAM) installed.
Consider other applications: If your server hosts multiple applications or services, you need to consider their memory requirements as well. Allocate memory accordingly to ensure smooth operation of all applications.
Reserve memory for the operating system: The operating system also requires memory to function efficiently. It’s recommended to reserve a portion of the total memory for the operating system. The exact min and max amount remaining free memory depends on the operating system and its requirements.
Monitor target server memory usage: Regularly monitor total server memory and usage on your server to identify any potential issues. If the server frequently runs out of memory, you may need to adjust the maximum server memory setting accordingly.
Use dynamic memory allocation: Some database management systems, such as Microsoft SQL Server, allow you to allocate memory based on system requirements dynamically. This can help optimize memory usage and prevent resource contention.
Test and adjust: It’s important to test the performance of your server after adjusting the maximum memory settings. Monitor the impact on performance and make further adjustments as needed.
Consider workload patterns: The optimal maximum server memory setting may vary depending on the workload patterns of your applications. For example, if your applications experience peak loads at certain times, you may need to adjust the same or set max server memory allocation accordingly.
Consult documentation and best practices: Consult the documentation provided by your database management system or other server software for specific recommendations and best practices regarding memory allocation.
Dynamic Memory Management
Dynamic Memory Management in SQL Server refers to the ability of the SQL Server Database Engine to dynamically adjust its memory usage based on the current workload and available system resources.
Here’s how dynamic memory management works in SQL Server:
Buffer Pool Management: SQL Server uses a portion of the system memory for its buffer pool, which is a cache where it stores data and indexes pages read from disk. The size and amount of memory in the buffer pool can be dynamically adjusted based on the memory requirements of other components and the workload on the server.
Memory Clerk Architecture: SQL Server uses a memory clerk architecture to manage memory dynamically. Memory clerks are responsible for allocating and managing memory for various components of SQL Server, such as the buffer pool, query execution, and other internal structures.
Resource Governor: SQL Server’s Resource Governor feature allows administrators to control the amount of memory allocated to different workloads or groups of queries. This helps prioritize memory usage for critical workloads and prevents one from consuming all available memory.
Automatic Memory Management: Starting from SQL Server 2012, SQL Server introduced automatic memory management features such as the “max and min server memory” setting and the “min server memory” default setting above. These settings allow administrators to specify the maximum and minimum amount of memory that SQL Server can use, and SQL Server dynamically manages memory within these limits based on workload demands.
Memory Pressure Detection: SQL Server continuously monitors system memory usage and adjusts its memory configuration and allocation in response to memory pressure. Memory pressure occurs when the system is running low on available memory, and SQL Server may respond by reducing the size of its buffer pool or other memory configuration and allocations to free up memory for other processes.
Memory Optimization Techniques
Memory optimization is critical in SQL Server environments to ensure efficient utilization of system resources and optimal performance. Here are some memory optimization techniques specific to SQL Server:
Configure Max Server Memory:
Set the maximum server memory configuration appropriately to prevent the SQL Server process from consuming all available memory on the system. This ensures that there is enough memory left for the operating system and other applications.
Consider leaving some memory for the operating system and other system processes to avoid resource contention.
Use 64-bit Architecture:
Deploy SQL Server on a 64-bit architecture to maximize the larger addressable memory space. This allows SQL Server to access more memory, improving performance, especially for memory-intensive workloads.
Use AWE (Address Windowing Extensions):
In older versions of SQL Server (pre-2012), on 32-bit systems with more than 4GB of physical memory, you can enable AWE to allow an instance of SQL Server to access additional memory beyond the 4GB limit. However, note that AWE is deprecated and not available as much memory as in newer versions of SQL Server.
Monitor Memory Usage:
Regularly monitor SQL Server memory usage using performance monitoring tools like Performance Monitor or built-in DMVs (Dynamic Management Views).
Identify memory bottlenecks, excessive memory grants, and memory-consuming queries to optimize memory usage.
Optimize Query Performance:
Tune queries to minimize memory usage by optimizing execution plans, reducing sorting and hashing operations, min memory, and eliminating unnecessary data retrieval.
Use appropriate indexing strategies to improve query performance and reduce memory requirements.
Use Resource Governor:
Utilize SQL Server’s Resource Governor feature to allocate memory resources among different workloads or groups of queries based on priority and importance.
Prevent resource contention by allocating memory resources judiciously to different workload groups.
Buffer Pool Extension:
Consider using Buffer Pool Extension (BPE) feature available in SQL Server Enterprise Edition to extend the buffer pool cache to SSD storage. This can help reduce the physical memory requirements while still improving performance by caching frequently accessed data on faster storage.
Monitoring and Troubleshooting Memory Issues
You can use T-SQL queries to retrieve information about critical performance counters related to memory in your SQL Server database. Below are examples of T-SQL queries to explore the Page Life Expectancy (PLE), Buffer Cache Hit Ratio, and Memory Grants Pending:
Page Life Expectancy (PLE):
This T-SQL query retrieves the current Page Life Expectancy in seconds:
SELECT [object_name],
    [counter_name],
    [cntr_value] AS 'Page Life Expectancy (seconds)'
FROM sys.dm_os_performance_counters
WHERE [object_name] LIKE '%Buffer Manager%'
    AND [counter_name] = 'Page life expectancy';
Buffer Cache Hit Ratio:
This T-SQL query retrieves the current Buffer Cache Hit Ratio:
SELECT [object_name],
    [counter_name],
    [cntr_value] AS 'Buffer Cache Hit Ratio'
FROM sys.dm_os_performance_counters
WHERE [object_name] LIKE '%Buffer Manager%'
    AND [counter_name] = 'Buffer cache hit ratio';
Memory Grants Pending:
This T-SQL query retrieves the current number of Memory Grants Pending:
SELECT [object_name],
    [counter_name],
    [cntr_value] AS 'Memory Grants Pending'
FROM sys.dm_os_performance_counters
WHERE [object_name] LIKE '%Memory Manager%'
    AND [counter_name] = 'Memory Grants Pending';
Additional Info
Links


Comments