SQL Server Locking, Blocking, And Deadlocks
- MikeBennyhoff
- Jan 3, 2023
- 11 min read
Updated: Feb 1, 2023

Overview
Locking, blocking and deadlocks are related concepts in SQL Server that deal with controlling concurrent access to data in a database. Concurrent access to data in a database refers to multiple users or processes accessing the same data simultaneously. This can occur when multiple transactions are executed at the same time, each trying to read or modify the same data. To ensure data integrity and consistency, a database management system like Microsoft SQL Server uses mechanisms such as locking and blocking to control access to data and prevent conflicting updates from occurring. Proper management of concurrent access is important for the performance and stability of a database system.
Locking:
Locking is a mechanism used by SQL Server to control concurrent access to data and ensure data integrity and consistency. Locks are acquired on data when a transaction starts and released when it ends.
Blocking:
Blocking problems when one transaction holds a lock on a piece of data that another transaction wants to access. The second transaction has to wait for the first to release the lock before it can continue. This can lead to performance issues and delay the completion of transactions.
Deadlocks:
Deadlocks occur when two or more transactions are blocked and each is waiting for the other to release a lock, resulting in a circular wait. This can lead to an indefinite wait situation and requires manual intervention to resolve. Deadlocks can be identified and resolved using SQL Server's Dynamic Management View (DMV) or by using SSMS, performance monitor or custom code as discussed below.
What Is The Difference Between Deadlock And Blocking?
Blocking: Blocking occurs when one transaction holds a lock on a piece of data that another transaction wants to access. The second transaction has to wait for the first to release the lock before it can continue. This can lead to performance issues and delay the completion of transactions.
Deadlocks are an unavoidable reality in SQL Server systems. They occur when two or more transactions become locked and must wait for the other to release a lock - creating an indefinite waiting situation that can cripple system performance issues and cause performance degradation unless promptly addressed. Fortunately, built-in tools like Deadlock Graphs allow users to identify and swiftly resolve these potentially with solid database administration and the use of the alerting process described below.
Locking Detail
SQL Server enables users to access data safely and securely by using locks. These range from shared locks, allowing multiple readers simultaneous access, to exclusive ones that prohibit any other user activity - ensuring only one person can interact with the guarded data at a time.
Types Of Locking In SQL Server
In SQL Server, there are two types of locking mechanisms: shared locks and exclusive locks.
Shared Locks:
A shared lock allows multiple transactions to read a piece of data, but only one transaction can hold an exclusive lock on the same piece of data at a time. Shared locks are used when a transaction needs to read data, but does not need to modify it.
Exclusive Locks:
Exclusive locks are used when a transaction needs to modify data. Exclusive locks prevent other transactions from reading or modifying the same data until the lock is released.
Lock Escalation
Lock escalation is a process in SQL Server where many fine-grained locks (e.g. row-level locks) are consolidated into fewer, higher-level locks (e.g. table-level locks) to reduce lock overhead and improve performance. Lock escalation is triggered when a transaction acquires a large number of locks on a single resource, such as a table. In such cases, SQL Server automatically converts the fine-grained locks into a fewer number of coarser-grained locks, freeing up system resources and reducing lock contention. However, lock escalation can also cause blocking and affect the performance of other transactions that need to access the same data. Thus, it's important to monitor and manage lock escalation to balance its benefits and drawbacks in a database system.
The Infamous (NOLOCK) and Other Locking Hints
In SQL Server, locking hints are used to specify the type of lock that should be acquired on a table or row when a query is executed. Locking hints can be used to override the default locking behavior of the SQL Server query optimizer.
Some examples of locking hints are Below:
NOLOCK:
Specifies that a query should not acquire any locks on the table or row being accessed. This can improve performance, but can also lead to dirty reads (reading data that is in the middle of being modified) or non-repeatable reads (reading data that has been modified since it was last read).
READPAST:
Specifies that a query should skip over rows that are locked, rather than waiting for the lock to be released. This can be used to avoid blocking in read-intensive workloads.
UPDLOCK:
Specifies that an update lock should be acquired when a query is executed. This prevents other transactions from modifying the data while the query is running, but allows other transactions to read the data.
TABLOCK:
Specifies that a table lock should be acquired when a query is executed. This prevents other transactions from accessing the table while the query is running.
ROWLOCK:
Specifies that a row-level lock should be acquired when a query is executed. This prevents other transactions from accessing the same row while the query is running.
It's important to note that Locking hints can affect the performance and scalability of a database, so they should be used judiciously and only when necessary. It is also important to test the impact of locking hints on your workload and to monitor the locking behavior of your queries to ensure that they are not causing contention or blocking.
How Can I Prevent SQL BLocking With NOLOCK
In T-SQL, the NOLOCK hint can be used to specify that a query should not acquire any locks on the table or row being accessed. This hint can be added to a SELECT statement by including the keyword "WITH (NOLOCK)" in the FROM clause, like this:
SELECT * FROM MyTable WITH (NOLOCK)It can also be added to a specific table within a JOIN statement like this:
SELECT * FROM MyTable1
JOIN MyTable2 WITH (NOLOCK) ON MyTable1.Id = MyTable2.Id
It's important to note that using the NOLOCK hint can improve query performance, but it can also lead to dirty reads (reading data that is in the middle of being modified) or non-repeatable reads (reading data that has been modified since it was last read). If your application requires accurate and consistent data, you should avoid using the NOLOCK hint. Also, in case of a high concurrency environment, it could lead to high contention and negatively impact the overall performance.
To Detect Locking In SQL Server Profiler, Follow These Steps:
Launch SQL Server Profiler and create a new trace.
In the Trace Properties dialog, select the Events Selection tab.
Select the Locks category and the Lock:Timeout and Lock:Deadlock events.
Run the trace and monitor the events to detect any lock timeouts or deadlocks.
Save the trace results to a table or a file for further analysis.
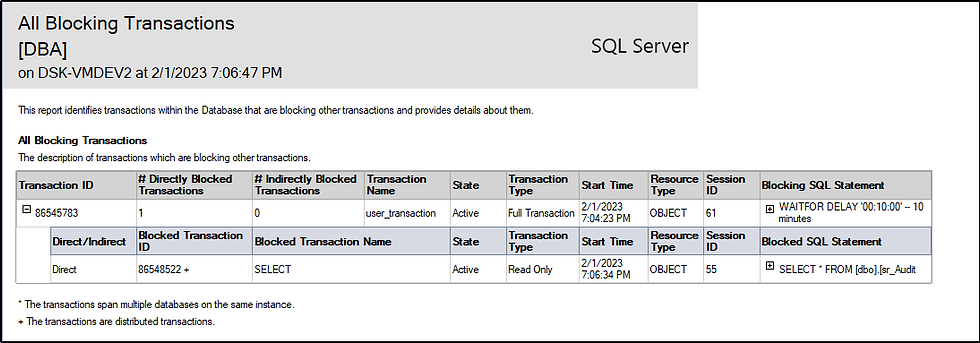
Blocking Transactions
Blocking is a situation that occurs when one process holds a lock on a resource and another process tries to acquire a conflicting lock on the same resource. The second process is blocked until the first process releases the lock. Blocking can occur when two processes are trying to update the same data concurrently, when one process is trying to read data that is being modified by another process.
Blocking can have a negative impact on the performance of a database, as it can cause processes to wait for locks to be released, leading to delays in query execution. To address blocking issues, you can use tools such as the sp_who2 system stored procedure or the sys.dm_exec_requests DMV to identify the processes that are causing blocking and determine the cause of the blocking. You can then take steps to optimize the queries or indexes to reduce or eliminate the blocking.
In the image below we can see two transactions try to access the same resources. One session (in green) locks acquired and the other is processes blocking transactions (red)

Creating A Blocking Situation To Observe Blocked Processes
Blocking situations can occur when two or more transactions are trying to access the same data at the same time. This can be both a nuisance and a major problem for database administrators. To test for blocking conditions, you can use a Transact-SQL (T-SQL) script. In this blog post, we will look at how to create a blocking situation test case with T-SQL.
Step 1: Create New Session
The first step is to create a new session in your database server environment. This can be done through the SQL Server (SSMS) by going to File > New > Query with Current Connection. Once the session is created, you can open up two separate query windows in SSMS and then connect each window to your database server environment using the same credentials.
Step 2: Set Isolation Level
Once you have opened up both query windows, you need to set the isolation level of each query window so that it is not blocked by other queries running in parallel. To do this, you need to run the following command in each query window: SET TRANSACTION ISOLATION LEVEL READ UNCOMMITTED; This command will allow the queries running in both sessions to run without being blocked by each other.
Step 3: Run Queries Simultaneously
BEGIN TRAN
  SELECT * FROM YourTable WITH (TABLOCKX, HOLDLOCK)
    WAITFOR DELAY '00:10:00' -- 10 minutes
ROLLBACK TRAN
Then in a 2nd SQL Server window, add the Blocked SQL Statement, to show the normal behavior or blocking
SELECT * FROM YourTableNow that our isolation levels are set, we can now begin running our queries simultaneously from both query windows. For example, let’s say that we want to update some data in one table while also performing an insert into another table at the same time. We would run both of these queries simultaneously from their respective query windows and see if any blocking occurs as a result of us running them together at the same time. If there is no blocking occurring then our test case has been successful!
blocking
35-second video showing blocking and the blocking report.
Blocked Process Report In SQL Server Professional
What Does the Blocked Process Report Show?
The Blocked Process Report shows detailed information about all blocked processes on your server at that time—including the host name of each computer involved in the blocked process; their login times; the SPID (server process ID); status; wait type; waits; resource description; current command executed by the process; and more. Using this information, you can determine which process is blocking other processes from completing their tasks correctly—which gives you the ability to take corrective action quickly and efficiently.
How Can I Interpret The Results?
Interpreting the results of a Blocked Process Report isn’t difficult—as long as you know what to look for. To start, you should look for processes with a wait type of “LCK_M_X” or “LCK_M_SCH-M” since these are typically associated with locking issues due to blocking.
Once you have identified those processes, focus on their SPIDs, logins, hosts names, status codes, resource descriptions, current commands executed by each process—all of which will help you pinpoint where there might be an issue with blocking. From there, you can start troubleshooting any issues accordingly until they are resolved.
Types Of Blocking In SQL Server
Blocking occurs when a transaction requests a lock on a piece of data that is already locked by another transaction. This can happen in several ways:
Read/Write Blocking: A transaction that is trying to read data is blocked by a transaction that has an exclusive lock on the same data. Similarly, a transaction that is trying to modify data is blocked by a transaction that has a shared or exclusive lock on the same data.
Intent Locks: An Intent lock is a type of lock that is used to indicate that a transaction intends to read or modify a specific range of data.
Key-Range Locks:
A Key-Range lock is a type of lock that is used to protect a specific range of data within a table or index.
Deadlocks:
Deadlocks occur when two or more transactions are blocking each other, each waiting for the other to release a lock.
It is important to understand how locking and blocking works in SQL Server, so that you can write efficient, concurrent code that avoids unnecessary blocking and deadlocks.
Detecting Blocking In SQL Server Management Studio
To detect blocking in your SQL Server instance using SQL Server Management Studio (SSMS), you can follow these steps:
Open SSMS and connect to the SQL Server instance.
In the Object Explorer, expand the "Management" node and click on "Activity Monitor".
In the Activity Monitor window, click on the "Processes" tab. This will show you a list of all processes that are currently running on the server.
To view details about the blocking processes, click on the "Blocking Processes" column header to sort the processes by the number of blocking processes.
To view more information about a specific blocking process, right-click on the process and select "View Process Detail" from the context menu. This will open a new window showing the details of the selected process, including the blocking SPID and the query that is being executed.
An Overview of the Blocked Process Report and How to Interpret It
A database administrator’s job often revolves around identifying, troubleshooting, and resolving performance issues. One tool that can help with this process is the Blocked Process Report in SQL Server. This report provides detailed information about any blocking issue on a server, which helps you isolate and address them quickly. Let’s break down what the report includes and how to interpret it.
What Does the Blocked Process Report Show?
The Blocked Process Report shows detailed information about all blocked processes on your server at that time—including the host name of each computer involved in the blocked process; their login times; the SPID (server process ID); status; wait type; waits; resource description; current command executed by the process; and more. Using this information, you can determine which process is blocking other processes from completing their tasks correctly—which gives you the ability to take corrective action quickly and efficiently.
How Can I Interpret The Results?
Interpreting the results of a Blocked Process Report isn’t difficult—as long as you know what to look for. To start, you should look for processes with a wait type of “LCK_M_X” or “LCK_M_SCH-M” since these are typically associated with locking issues due to blocking.
Once you have identified those processes, focus on their SPIDs, logins, hosts names, status codes, resource descriptions, current commands executed by each process—all of which will help you pinpoint where there might be an issue with blocking. From there, you can start troubleshooting any issues accordingly until they are resolved.
Detecting Blocking In Code In Your SQL Server Instance
It's important to monitor for blocking on a regular basis to ensure that the performance of the database is not impacted by blocking issues. If you do identify blocking, you can use tools such as the sys.dm_exec_requests DMV to investigate the cause of the blocking and take steps to optimize the queries or indexes to reduce or eliminate the blocking.
I have also attached code in Github to detect blocking and send an HTML e-mail when blocking occurs for more than 5 minutes.
Alternatively, you can use the sp_who2 system stored procedure to view information about blocking processes. This stored procedure returns a result set that includes the SPID, Status, Blocking, and Wait Time columns, which can be used to identify blocking processes and troubleshoot performance issues.
Detecting Blocked Processes With SP_WHO2
SP_WHO2 is a stored procedure in SQL Server that is used to display information about current users and processes connected to a SQL Server instance. It provides information such as the login name, host name, process ID, and status of the connections. To use SP_WHO2, you can execute the following query "EXEC SP_WHO2" in the query window of SQL Server Management Studio. This will display all the information about the current connections to the and Blocked Processes.

Killing Blocking Processes In SQL Server Management Studio
Once you have found the blocking SQL statement that is causing issues, you can stop that process by using the Kill command - See my blog here for more information and end the blocked processes.
How To Kill A Process In SSMS
Deadlock
A deadlock in SQL Server occurs when two or more transactions are blocked and are unable to proceed because they are each waiting for one of the other transactions to release a lock. This results in a situation where neither transaction can move forward, creating a "deadlock" situation. Deadlocks can cause performance issues and may also cause certain transactions to fail. SQL Server can detect and resolve deadlocks automatically, but they can also be prevented by carefully designing and indexing tables, and by using the appropriate locking hints and isolation levels in the Transact-SQL code.

Additional resources:
You can also purchase my product, Product SQL Maintenance And Management, if you want to Troubleshoot blocking, expand standard reports, If lock based concurrency and lock escalation are not your true calling. Let me help you administer your SQL Server with my 20 years of experience and my software package that has the following built-in...
Blocked Process Report, Locking and Blocking Report and Extended Events Session Monitoring
--Cheers Mike B


Comments